Bank of Latvia money museum
Designed the two main media exhibits of the central bank’s money museum, including a walk-up tool that compares up to three indicators across Europe.
- Client
- Bank of Latvia
- Country
- Latvia
- Industry
- Finance, museum, data visualization
- Year
- 2016–2026
- My role
- Project lead and UX designer on the data visualization
- Team
- UI designer, developer, historian and data researcher; bank staff validated the data
Problem
The museum was being redesigned, with more than 20 screens and exhibits. Its two centerpieces had to make complex economic data explorable for walk-up visitors.
- Economic, geographic and demographic data for countries across Europe
- Two very different exhibits: a physical globe and the museum’s largest touchscreen
Approach
Every decision traces back to evidence. Each step has an ID, and every insight and decision names the evidence it came from.
S001
Source
Data research
Figures gathered by a historian and data researcher.
S002
Source
Bank staff
Validating the data before it went on screen.
E001
Evidence
Many categories
Economy, geography, demographics and more.
From S001
E002
Evidence
Gaps in the data
Not every country has data for every indicator.
From S001
I001
Insight
Comparison makes it readable
A few indicators, side by side, say more than one table.
From E001
D001
Decision
Up to three parameters
Visitors pick, for example, GDP and death rate.
From I001
D002
Decision
One ranking, green to red
The choices combine into a relative ranking on the map of Europe.
From I001, E002
D003
Decision
A touchscreen for the globe
Projectors inside the globe, controlled from outside.
From S001
Solution
I led the project and the UX of the data visualization. My team also designed the globe’s control interface.
Data visualization
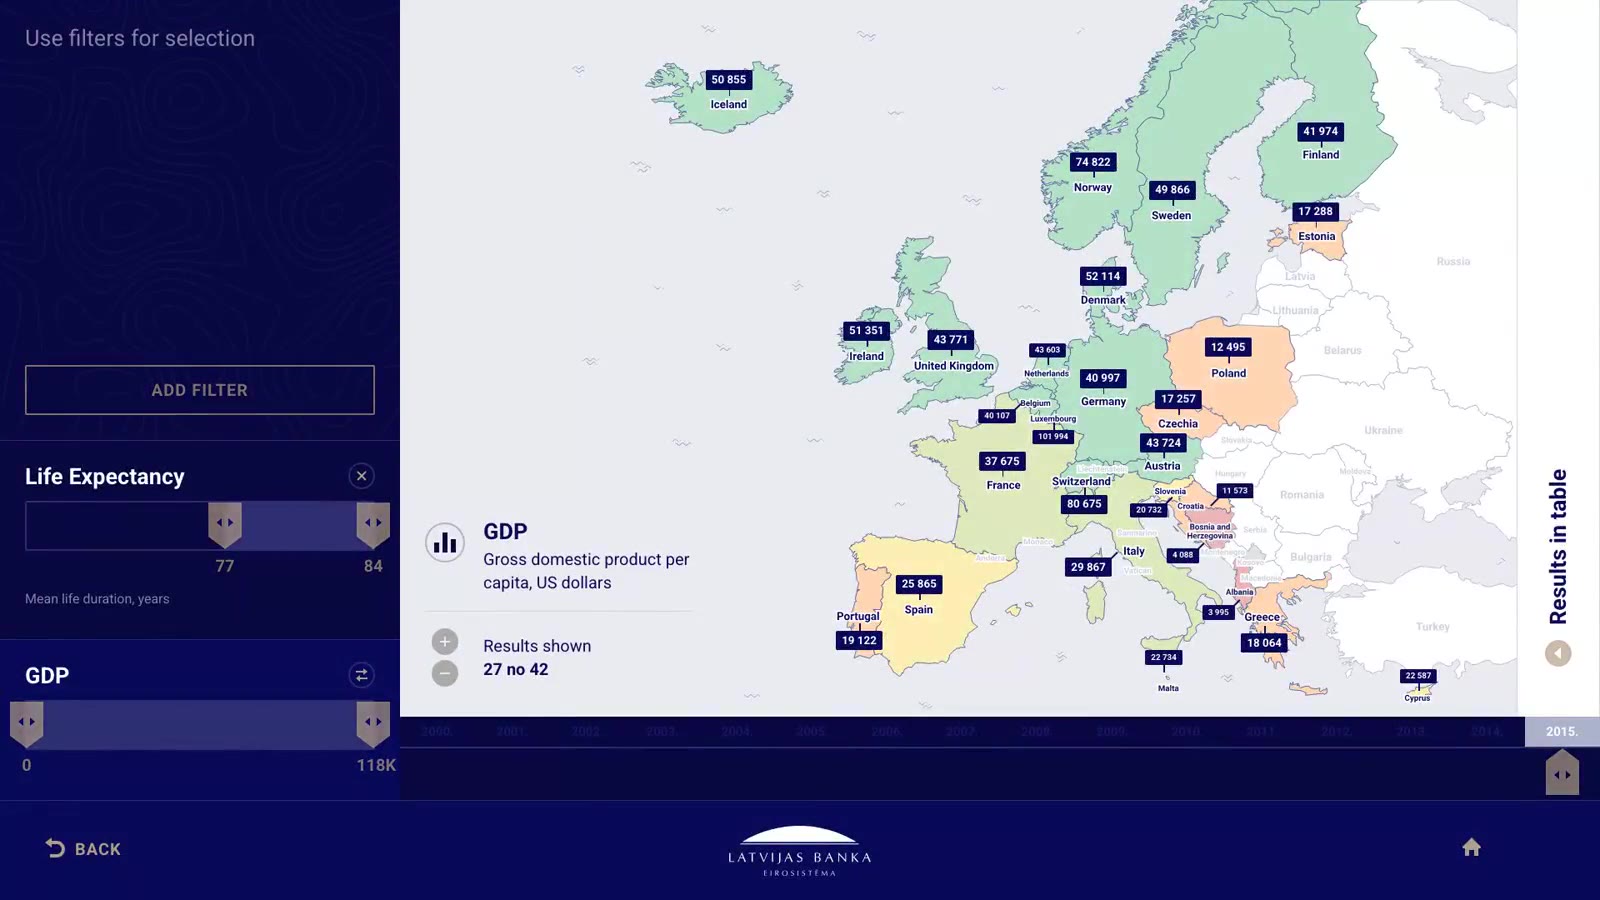
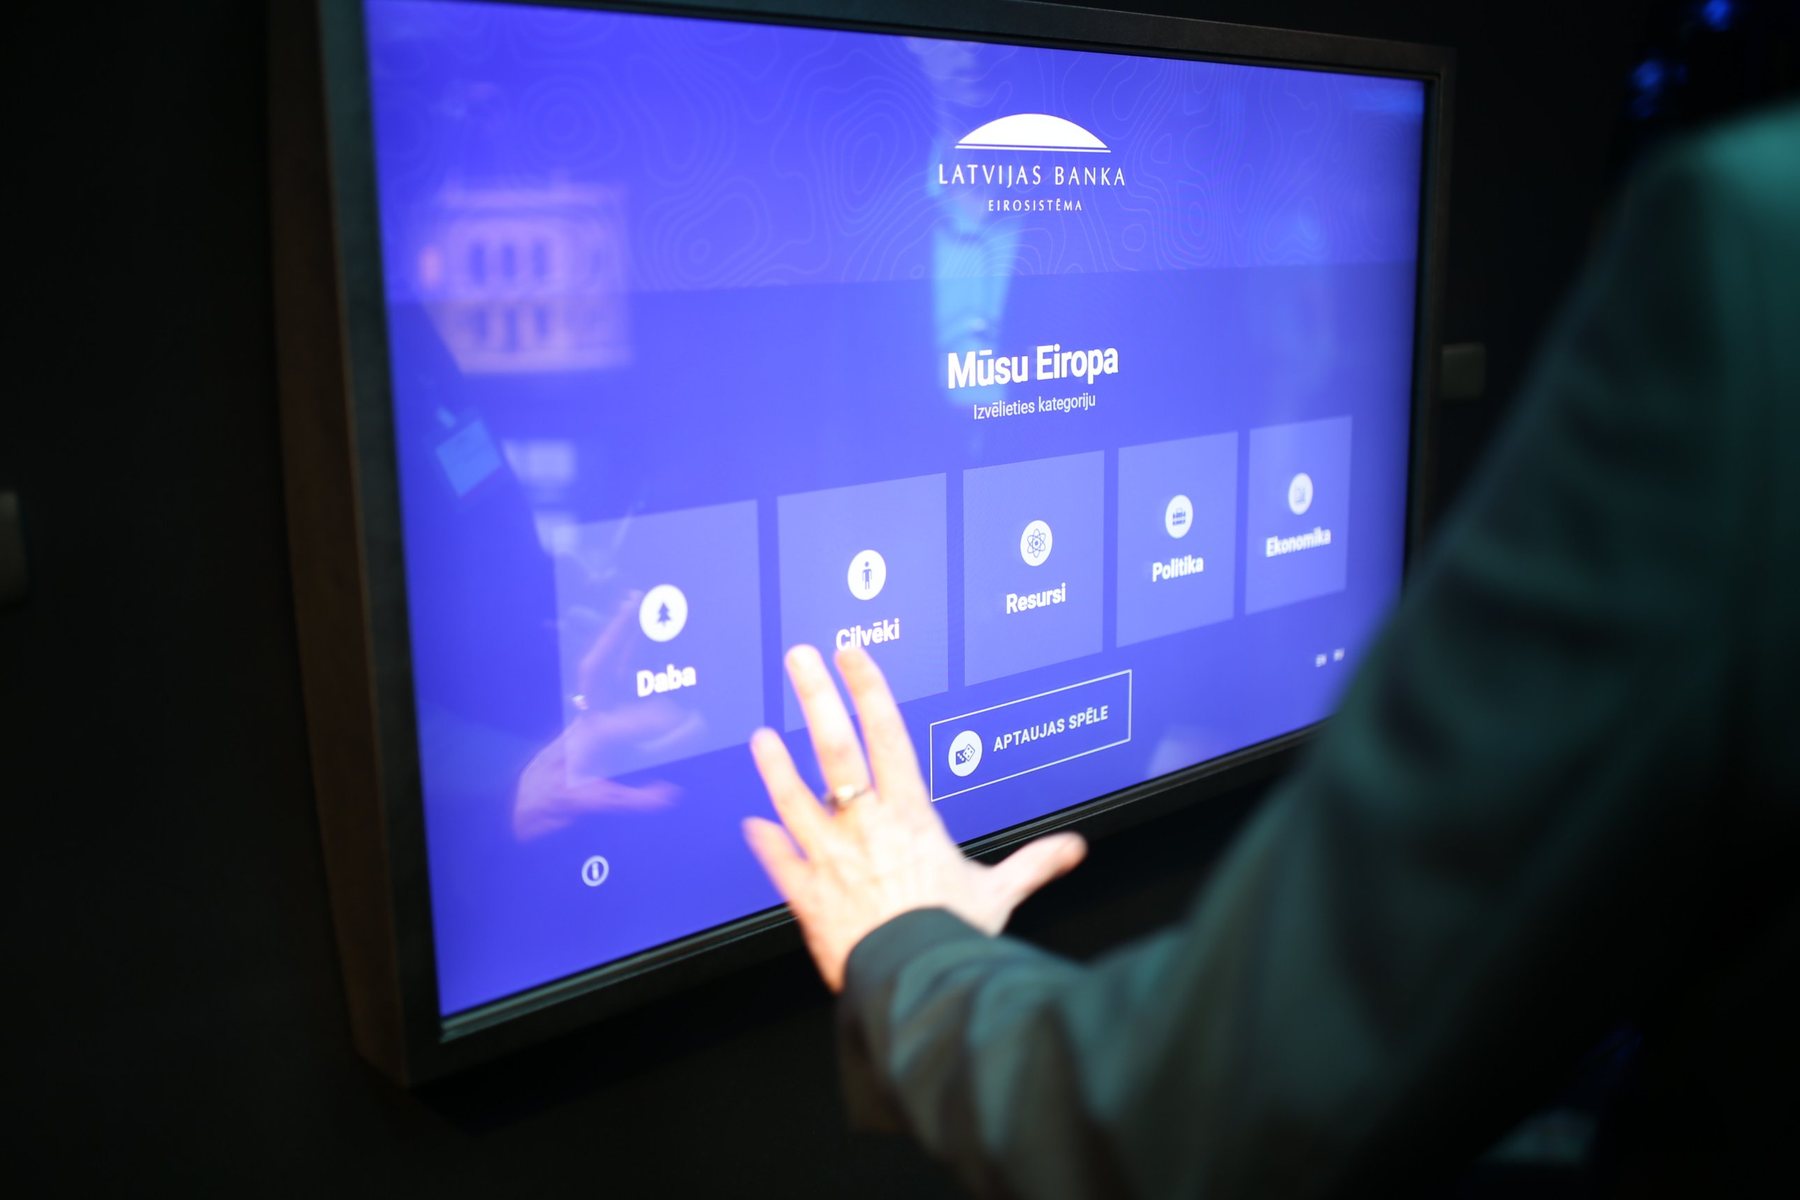
On the museum’s largest touchscreen, visitors explore Europe by category.
- Categories such as economy, geography and demographics
- Up to three parameters at once, for example GDP and death rate
- The selection combines into a relative ranking across the countries that have data for all of them
- Shown on the map of Europe, on a green-to-red scale
Globe
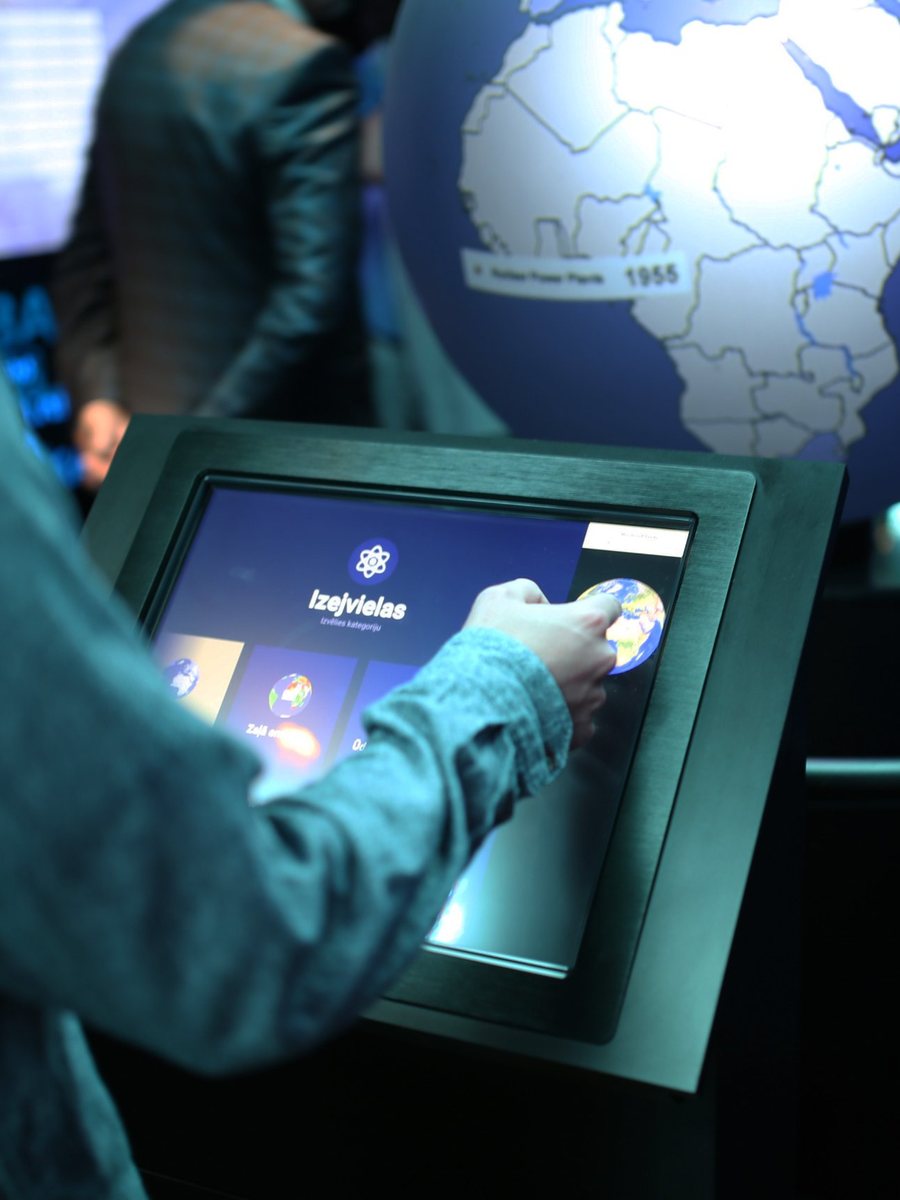
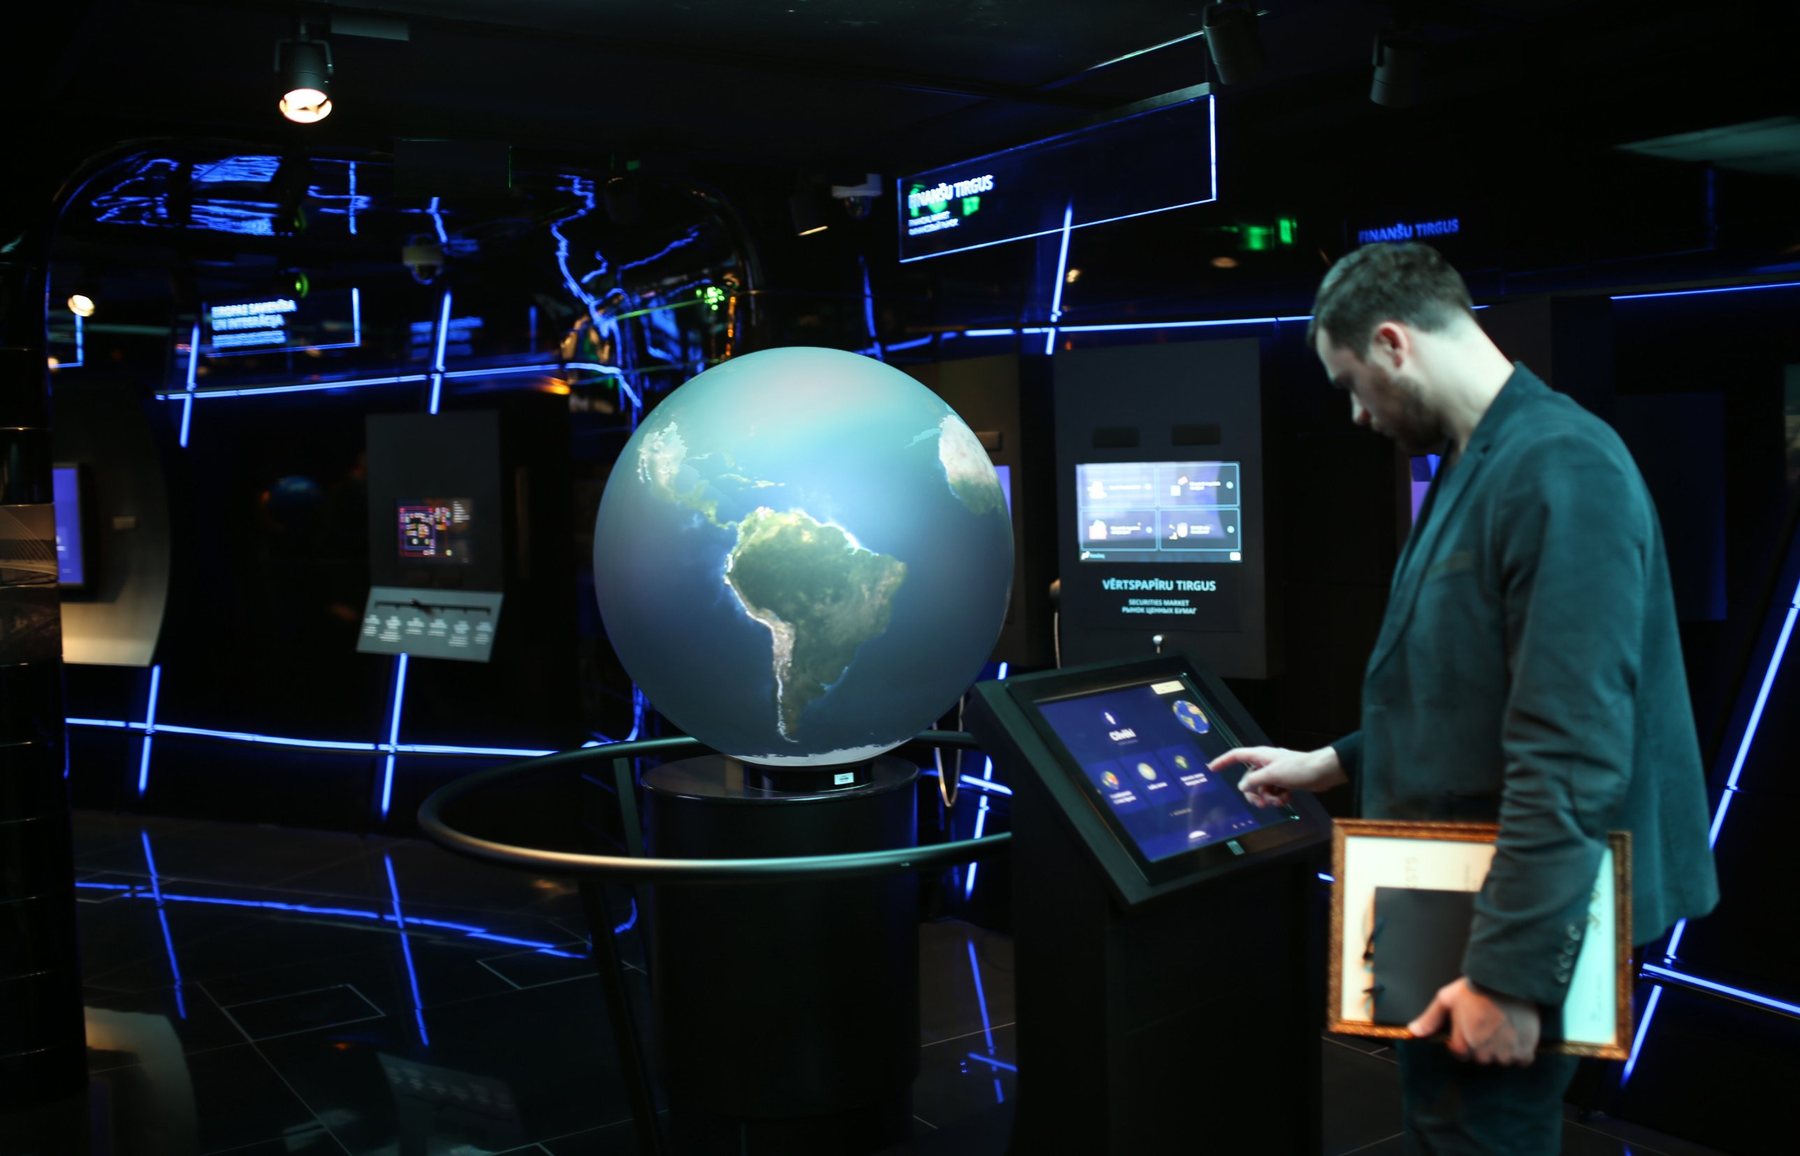
Projectors inside a physical globe, controlled from an external touchscreen. We designed the touchscreen interface.
Outcome
Both centerpiece exhibits are still running. Visitors compare up to three indicators at once, and the data is updated twice a year with current figures.